

Shallow depth of field (selective focus) with details of a chart showing the stock market crash from March 2020 due to the Covid-19 pandemic on a computer screen (S&P500 index)
Коллекция по умолчанию
Коллекция по умолчанию
Создать новую

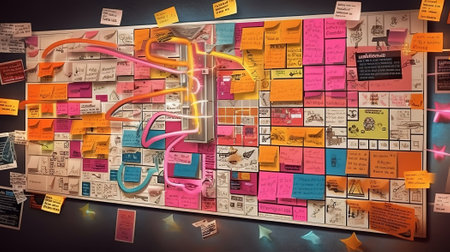
Colorful sticky notes scattered on a dark surface represent brainstorming and organization in a modern office setting, showcasing creativity and collaborative planning.
Коллекция по умолчанию
Коллекция по умолчанию
Создать новую
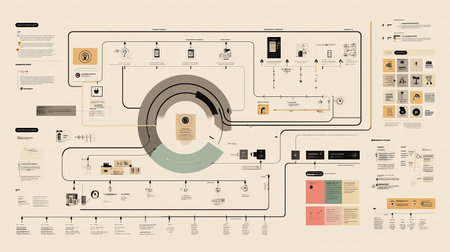
Modern infographics options banner. Use for workflow layout, diagram, annual report, web design.
Коллекция по умолчанию
Коллекция по умолчанию
Создать новую

Close up image of a flowchart showing various steps of a process, representing workflow, stages, and methodology.
Коллекция по умолчанию
Коллекция по умолчанию
Создать новую

Market segmentation and targeting concept. Color figures on the desk.
Коллекция по умолчанию
Коллекция по умолчанию
Создать новую
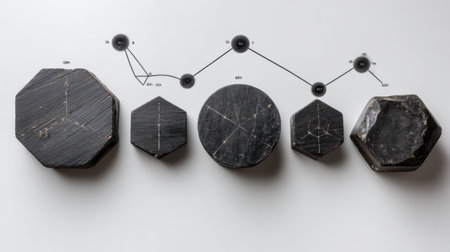
Abstract stone shapes arranged in a sequence show geometrical patterns and connections illustrating computational thinking concepts and ideas.
Коллекция по умолчанию
Коллекция по умолчанию
Создать новую

Colorful fraction circles arranged into a circle graph and hand, black background.
Коллекция по умолчанию
Коллекция по умолчанию
Создать новую
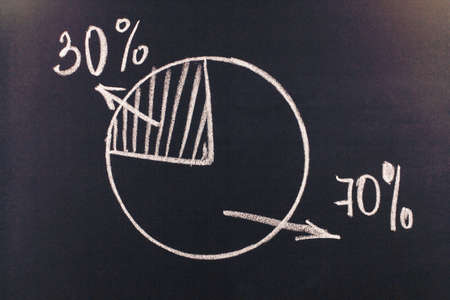
drawing with chalk on a blackboard
Коллекция по умолчанию
Коллекция по умолчанию
Создать новую
An office worker shows his colleagues a presentation with a company development graph at night on the company's computer
Коллекция по умолчанию
Коллекция по умолчанию
Создать новую

A timeline chart showing events and milestones over time AI generated
Коллекция по умолчанию
Коллекция по умолчанию
Создать новую
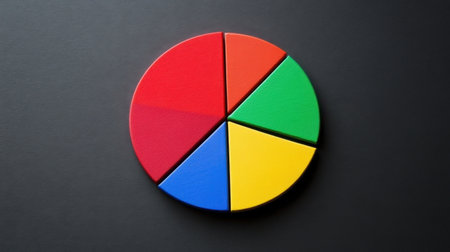
This image features a colorful segmented circle design against a dark background, perfect for creative projects, educational materials, or graphic designs.
Коллекция по умолчанию
Коллекция по умолчанию
Создать новую

reports
Коллекция по умолчанию
Коллекция по умолчанию
Создать новую

Line graph on desk and pen. Vintage filter
Коллекция по умолчанию
Коллекция по умолчанию
Создать новую

World money concept, macro detailed on a 20 Euro banknote, macro photo of EURO currency
Коллекция по умолчанию
Коллекция по умолчанию
Создать новую

list of post pandemic economical recession keywords next to graph with negative stats, concept of inflation and shortages
Коллекция по умолчанию
Коллекция по умолчанию
Создать новую
2020 concept. Graph of economics growth on chalk board, empty space
Коллекция по умолчанию
Коллекция по умолчанию
Создать новую

A colorful wooden block with an arrangement of stair or graph.
Коллекция по умолчанию
Коллекция по умолчанию
Создать новую

Wooden Blocks Connected in a Network Showing Various Technology Icons, generative Ai
Коллекция по умолчанию
Коллекция по умолчанию
Создать новую
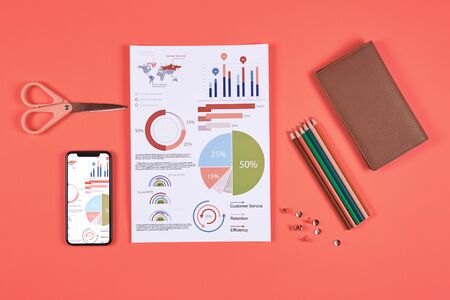
Above view flat lay of business data charts and office supplies over coral background, copy space
Коллекция по умолчанию
Коллекция по умолчанию
Создать новую

Zoomed in on a screen showing a colorcoded timeline that visualizes shifts in consumer demand overlaid with alerts for immediate adjustments to production schedules
Коллекция по умолчанию
Коллекция по умолчанию
Создать новую

on the chalkboard sign woman, man graphic, sexually active, frigid
Коллекция по умолчанию
Коллекция по умолчанию
Создать новую

Sugar cubes are stacked in a column in an increasing direction on a dark background. Harmful to health. Diabetes.
Коллекция по умолчанию
Коллекция по умолчанию
Создать новую

A vibrant bar chart displayed on a dark surface, showcasing data analysis and statistical trends, ideal for business presentations and reports.
Коллекция по умолчанию
Коллекция по умолчанию
Создать новую

A modern workspace featuring a clipboard adorned with sticky notes, perfect for organizing ideas and planning projects in creative and professional settings.
Коллекция по умолчанию
Коллекция по умолчанию
Создать новую
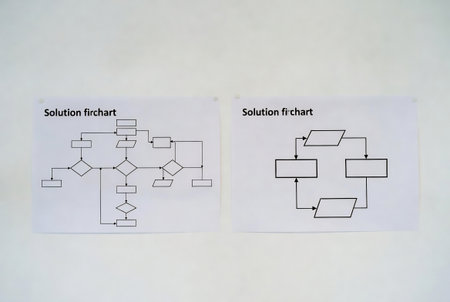
Diagram showing the structure of a molecular structure of Sulfur dioxide.
Коллекция по умолчанию
Коллекция по умолчанию
Создать новую

Business graph diagram with multicolored bars with rise dynamic against blue background
Коллекция по умолчанию
Коллекция по умолчанию
Создать новую

A close-up of a mind map drawn on a whiteboard, with colorful branches representing different concepts and connections, capturing the process of brainstorming.
Коллекция по умолчанию
Коллекция по умолчанию
Создать новую
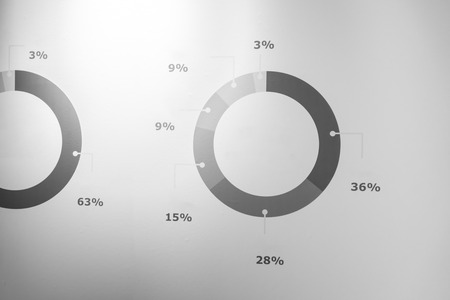
Graphic and circle diagram on white wall. Business info graphic interface design concept.
Коллекция по умолчанию
Коллекция по умолчанию
Создать новую

Graph of market share with black pen in business concept
Коллекция по умолчанию
Коллекция по умолчанию
Создать новую

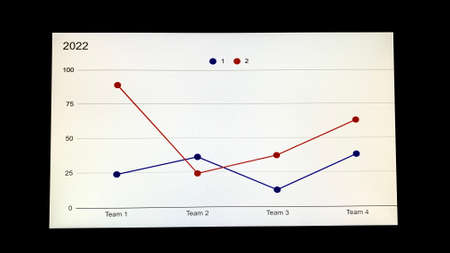
business analysis and statistics concept, positive and negative trends on graphs on notebooks side by side
Коллекция по умолчанию
Коллекция по умолчанию
Создать новую

Team work with results and reports
Коллекция по умолчанию
Коллекция по умолчанию
Создать новую

Businessmen miniature figure standing on investment and profit graph for analysis and discussion.
Коллекция по умолчанию
Коллекция по умолчанию
Создать новую

Flattened curve for covid-19 infections on monitor screen. Royalty free stock photo.
Коллекция по умолчанию
Коллекция по умолчанию
Создать новую

A vibrant collection of data visualization elements including colorful charts and graphs arranged on a dark surface, ideal for business analysis and presentation needs.
Коллекция по умолчанию
Коллекция по умолчанию
Создать новую
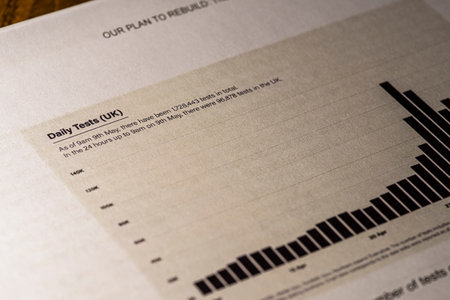
London, UK - May 11th 2020: Daily Tests heading in the document Our Plan To Rebuild - the UK Governments COVID-19 recovery strategy.
Коллекция по умолчанию
Коллекция по умолчанию
Создать новую
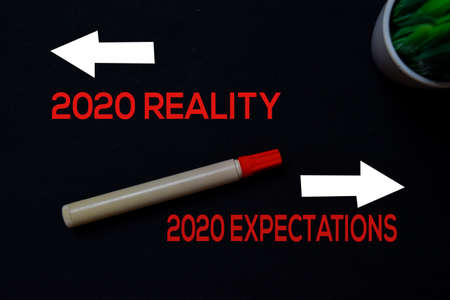
2020 Reality or 2020 Expectations write on black board background.
Коллекция по умолчанию
Коллекция по умолчанию
Создать новую

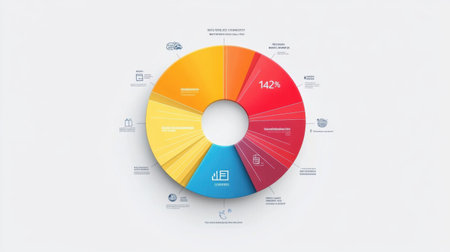
3d pie chart showcasing business data percentages, set against a seamless gradient background
Коллекция по умолчанию
Коллекция по умолчанию
Создать новую
reports
Коллекция по умолчанию
Коллекция по умолчанию
Создать новую

Close-up of a stock market analysis chart with a mix of bar graphs and line graphs highlighting key data
Коллекция по умолчанию
Коллекция по умолчанию
Создать новую
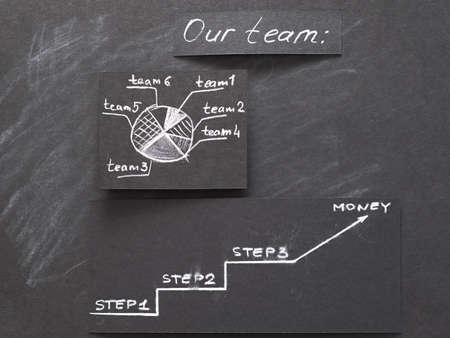
pie graph with segments and steps to earning money. teamwork company strategy. diagram on black chalkboard.
Коллекция по умолчанию
Коллекция по умолчанию
Создать новую
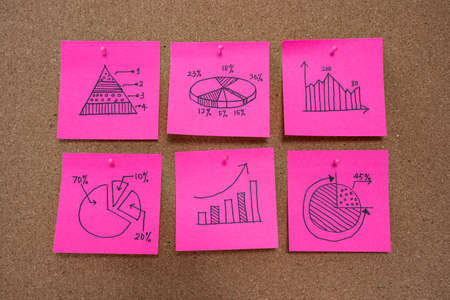
Different business graph charts on pink sticky notes for business planning and analysis
Коллекция по умолчанию
Коллекция по умолчанию
Создать новую

Trader investor broker holding finger using cell phone app executing financial stock trade market trading order to buy or sell
Коллекция по умолчанию
Коллекция по умолчанию
Создать новую

Wooden block business growth with arrow up. Business growth rates, creative ideas graph business development to grow profit and success for target concept.
Коллекция по умолчанию
Коллекция по умолчанию
Создать новую

Study guide with mind map and structured headings placed beside planner and pens
Коллекция по умолчанию
Коллекция по умолчанию
Создать новую

diagram pointing down. decline drop reduction concept. exponential curve on dark blue backdrop.
Коллекция по умолчанию
Коллекция по умолчанию
Создать новую

Wood bar block or yellow and black colour with line around. Top view
Коллекция по умолчанию
Коллекция по умолчанию
Создать новую
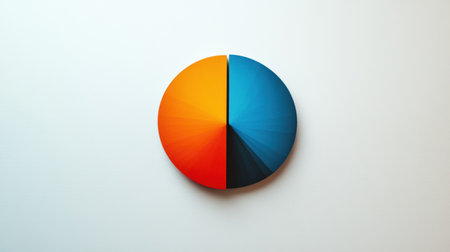
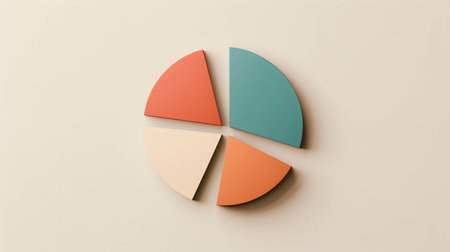
A divided pie chart in vibrant orange and blue colors placed against a light background illustrating data segmentation.
Коллекция по умолчанию
Коллекция по умолчанию
Создать новую

Kuala Lumpur, Malaysia, 24th July 2020: Close up Instagram application menu on smartphone screen. Instagram is a photo and video-sharing social networking service owned by Facebook.
Коллекция по умолчанию
Коллекция по умолчанию
Создать новую
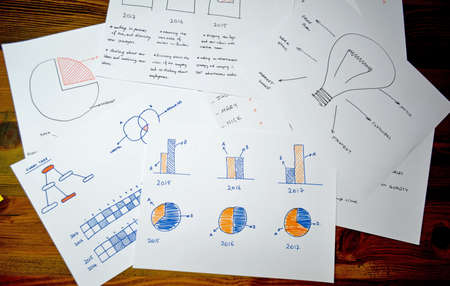
An AI generated illustration of project management graphs charts paper
Коллекция по умолчанию
Коллекция по умолчанию
Создать новую
A vibrant pie chart infographic showcasing diverse data segments, ideal for business presentations, data analysis projects, and engagement visualizations.
Коллекция по умолчанию
Коллекция по умолчанию
Создать новую

A detailed diagram illustrates project management strategies with colorful nodes and connections, symbolizing teamwork and effective planning in a business environment.
Коллекция по умолчанию
Коллекция по умолчанию
Создать новую

Business plan documents and charts for eco-tourism startup on rustic wooden table
Коллекция по умолчанию
Коллекция по умолчанию
Создать новую

A high-resolution image of a rotating 3D pie chart, highlighting financial performance metrics with clear, labeled sections and a neutral backdrop.
Коллекция по умолчанию
Коллекция по умолчанию
Создать новую

Radiated emissions spectrogram with limit lines in EMC electromagnetic compatibility test report
Коллекция по умолчанию
Коллекция по умолчанию
Создать новую

Colored sticker stripes on business analytics chart closeup
Коллекция по умолчанию
Коллекция по умолчанию
Создать новую

ballpoint pen indicates income graphs lying on the table
Коллекция по умолчанию
Коллекция по умолчанию
Создать новую
Pie charts representing diversified stock portfolios, diversification of investment or asset allocation on stock and fund and bond make investments more efficient
Коллекция по умолчанию
Коллекция по умолчанию
Создать новую

This image showcases an abstract representation of a network, featuring colorful tokens on a technical blueprint. It highlights connections, interactions, and design elements.
Коллекция по умолчанию
Коллекция по умолчанию
Создать новую
Monthly percentage bar chart showing financial comparison of 2026 budget versus actual performance data displayed on digital screen. Results tracking.
Коллекция по умолчанию
Коллекция по умолчанию
Создать новую
Stock market business graph chart on digital screen
Коллекция по умолчанию
Коллекция по умолчанию
Создать новую

Chalkboard with ladder made of wooden blocks arrows up. Increase, rise, grow up. Business statistic. Career, money, success. Financial progress step by step on stacking blocks. Business flat lay.
Коллекция по умолчанию
Коллекция по умолчанию
Создать новую

Online stock exchange application with information on screen, closeup
Коллекция по умолчанию
Коллекция по умолчанию
Создать новую
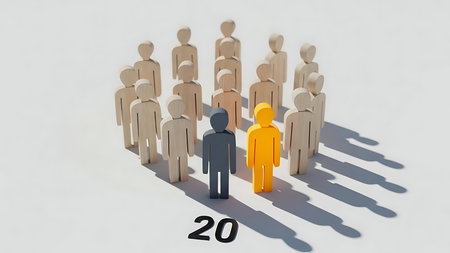
3d rendering of a group of people standing in a circle with the number 2020
Коллекция по умолчанию
Коллекция по умолчанию
Создать новую

3d render graph over gray background, rainbow business infographic, panoramic layout
Коллекция по умолчанию
Коллекция по умолчанию
Создать новую

Close up image of a flowchart showing various steps of a process, representing workflow, stages, and methodology.
Коллекция по умолчанию
Коллекция по умолчанию
Создать новую

A clipboard holds a document with handwritten notes and yellow highlights. Two small receipts are placed nearby, all resting on a textured concrete surface.
Коллекция по умолчанию
Коллекция по умолчанию
Создать новую

Colorful wooden blocks on the table in the office, business concept
Коллекция по умолчанию
Коллекция по умолчанию
Создать новую

A vibrant and dynamic workspace showcasing an organized table filled with colorful sticky notes, documents, and essential tools for brainstorming and planning sessions.
Коллекция по умолчанию
Коллекция по умолчанию
Создать новую
infographic template with outline icons. thin line icons such as overview, advertisement. Generative Ai
Коллекция по умолчанию
Коллекция по умолчанию
Создать новую

Abstract colorful background showing lines and dots creating a modern design
Коллекция по умолчанию
Коллекция по умолчанию
Создать новую

Many type of infographic diagram over white background. Top view.
Коллекция по умолчанию
Коллекция по умолчанию
Создать новую

business analysis and statistics concept, desk with mixed graphs and charts on clipboard
Коллекция по умолчанию
Коллекция по умолчанию
Создать новую

pie graph with segments. teamwork cooperation and labor division and work delegation. diagram on black chalkboard.
Коллекция по умолчанию
Коллекция по умолчанию
Создать новую

A top-down view of a business strategy flowchart laid out on a cardboard sheet, surrounded by US dollars, coins, a vintage camera, and pens.
Коллекция по умолчанию
Коллекция по умолчанию
Создать новую
A colorful paper pie chart showcases pastel hues on a minimalist background, creating an engaging visual representation of data and creativity.
Коллекция по умолчанию
Коллекция по умолчанию
Создать новую
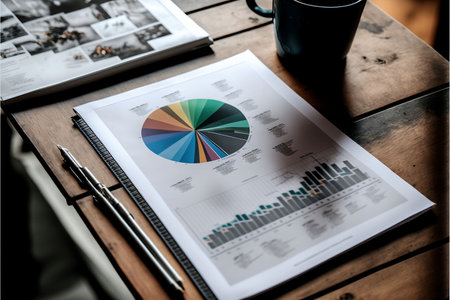
A modern workspace scene featuring a cup of coffee beside a laptop, with charts and graphs showcasing data analysis for productivity and business growth.
Коллекция по умолчанию
Коллекция по умолчанию
Создать новую

Colorful wooden blocks in a row on the background of a graph
Коллекция по умолчанию
Коллекция по умолчанию
Создать новую

business analysis and statistics concept, desk with mixed graphs and charts on clipboard
Коллекция по умолчанию
Коллекция по умолчанию
Создать новую

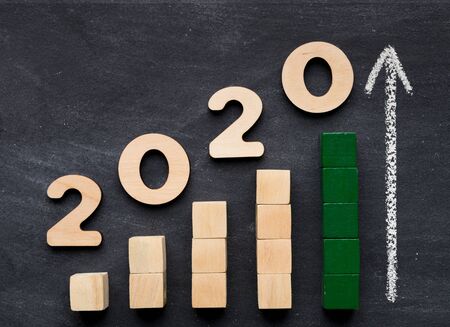
2020 written in red numbers with white background using Hama beads,
Коллекция по умолчанию
Коллекция по умолчанию
Создать новую

Exploring colorful map with smartphone in hand, revealing connections and locations.
Коллекция по умолчанию
Коллекция по умолчанию
Создать новую

Close up making agenda Daily schedule on personal organizer. Business and entrepreneur concept. Isolated on a black background
Коллекция по умолчанию
Коллекция по умолчанию
Создать новую
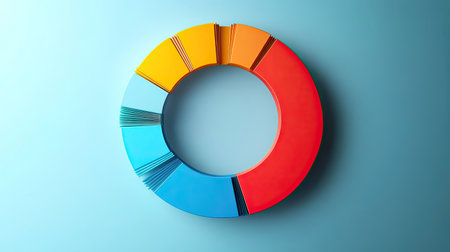
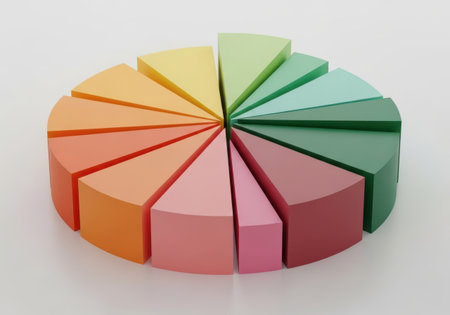
Circular chart with shadow effects and 3D depth, realistic and impactful
Коллекция по умолчанию
Коллекция по умолчанию
Создать новую

Candle stick graph chart with indicator showing bullish point or bearish point, up trend or down trend of price of stock market or stock exchange trading, investment and financial concept.
Коллекция по умолчанию
Коллекция по умолчанию
Создать новую
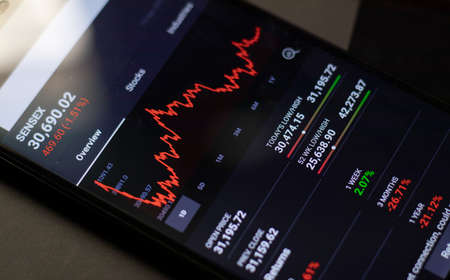
Maski, India - April 14, 2020 : Crash in sensex share market on mobile during covid-19 lockdown.
Коллекция по умолчанию
Коллекция по умолчанию
Создать новую
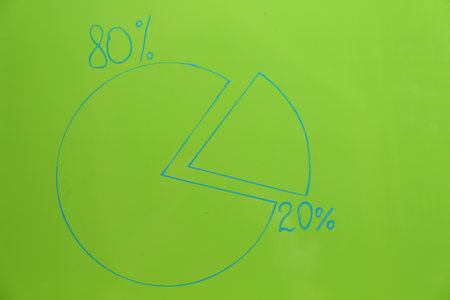
Chart with 80/20 rule representation on green background. Pareto principle concept
Коллекция по умолчанию
Коллекция по умолчанию
Создать новую
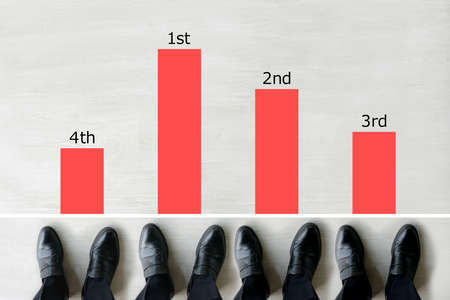
Image of businessman's business performance and annual income graph and ranking
Коллекция по умолчанию
Коллекция по умолчанию
Создать новую

business documents over papers with numbers and charts. View from above
Коллекция по умолчанию
Коллекция по умолчанию
Создать новую

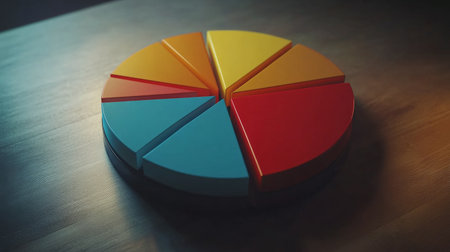
Colorful pie chart on wooden table, representing data visualization and analysis..
Коллекция по умолчанию
Коллекция по умолчанию
Создать новую
This vibrant data visualization chart presents a colorful analysis of various statistical categories, featuring clear trends over time in an engaging manner.
Коллекция по умолчанию
Коллекция по умолчанию
Создать новую

image of the financial graph on a computer monitor.
Коллекция по умолчанию
Коллекция по умолчанию
Создать новую
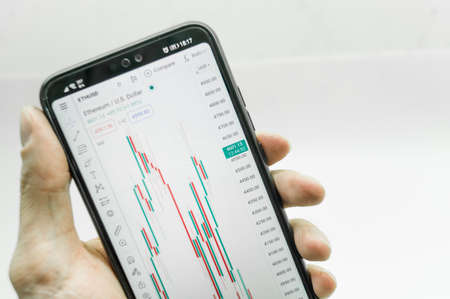
A chart of financial exchange quotes on a smartphone screen in hand. Trading on the stock exchange from a mobile phone. Close-up, selective focus
Коллекция по умолчанию
Коллекция по умолчанию
Создать новую
Colorful pie chart with multiple segments
Коллекция по умолчанию
Коллекция по умолчанию
Создать новую
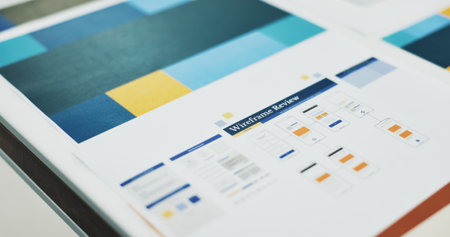
Documents, wireframe chart and review in empty office, startup and ux design with icon at company. Paperwork, graph and connection with flowchart, mobile app ui and development for user experience
Коллекция по умолчанию
Коллекция по умолчанию
Создать новую
Colorful pie chart with vibrant segments displayed on a table, ideal for showcasing data analysis and business presentations in a creative and engaging manner.
Коллекция по умолчанию
Коллекция по умолчанию
Создать новую

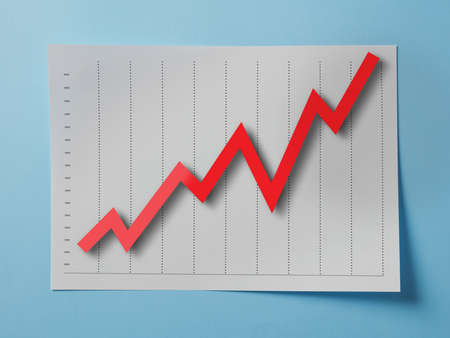
A close-up of a line graph showing financial growth trends over time
Коллекция по умолчанию
Коллекция по умолчанию
Создать новую

Stock market candlestick chart, asset prices movement, currency exchange price action simple concept. Computer screen, display, candle chart, graph detail, extreme closeup, nobody, no people
Коллекция по умолчанию
Коллекция по умолчанию
Создать новую

Drawing a house plan with a red flower on a piece of paper
Коллекция по умолчанию
Коллекция по умолчанию
Создать новую

Dynamic whiteboard filled with colorful sticky notes and flowcharts representing ideas and processes, ideal for showcasing collaboration and creative thinking in modern environments.
Коллекция по умолчанию
Коллекция по умолчанию
Создать новую

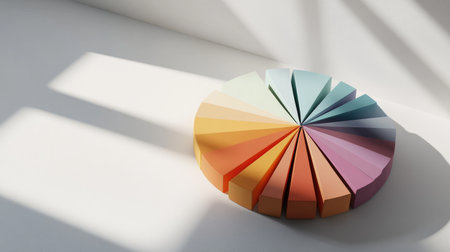
A vibrant display of pastel color swatches arranged on a light background, ideal for exploring color combinations and creative design concepts. Perfect for artists and designers.
Коллекция по умолчанию
Коллекция по умолчанию
Создать новую

A vibrant doughnut with a variety of colors placed on top of a black surface, A doughnut chart comparing high performing and low performing investments, AI Generated
Коллекция по умолчанию
Коллекция по умолчанию
Создать новую
Legion-Media
Создайте свои проекты на основе качественных стоковых фотографий и видео.


Copyright © Legion-Media.